

The option chain is a great tool for investors. Budding option traders have a variety of tools for trading. they must familiarize themselves with. One which they will find themselves returning to again and again is the option chain. This particular feature displays pricing information for call-and-put options along with a handful of other key metrics used by the everyday option trader. Every broker or trading platform that caters to option traders will undoubtedly have an option chain for you to use. Today, we will highlight and define each piece of information to make sure you’re properly equipped to assess all the data in this indispensable tool.
Consider the option chain for Google (GOOGLE) displayed below with 12 key items identified:
- This is where traders can select the expiration month to view. Most optionable securities have at least 5 different months to choose from: the front two months, the next two quarters, and LEAPS.
- This blue box is where all the volatility information is displayed. HV stands for “historical volatility” and measures how volatile the underlying stock has been over the past 5, 20, 60, and 90 days. IV stands for “implied volatility” and is derived from option premiums. Consider IV an estimate of how volatile the stock will be in the future.
- The four columns in the red box are referred to as “the Greeks.” Delta, gamma, vega, and theta measure how much the option will fluctuate in price given a change in the stock price, volatility, or time.
- The IV column displays the implied volatility for each individual strike price.
- OI stands for “open interest” and measures the total number of open contracts. This number increases or decreases over time as additional option contracts are opened or closed. The OI reveals how liquid or actively traded a particular option is.
- The volume column measures how many contracts were traded just today. Volume resets to zero each day.
- The net column measures how much the option has changed in value based on the last price it traded at.
- The bid price is the price at which traders can sell the option contract.
- The asking price is the price at which traders can buy the option contract. The difference between the bid and ask is called the “bid-ask spread.” Traders prefer this spread to be as narrow as possible.
- The last price is simply the last price the option traded for. Keep in mind this price may be old if the option hasn’t been traded recently.
- Each option has its own unique ticker symbol listed in this column.
- The center of the option chain is where the strike prices are listed (in the green box). Each row represents a different strike price. This column separates call options (on the left) from put options (on the right).
Author Profile

- Jonas Taylor is a financial expert and experienced writer with a focus on finance news, accounting software, and related topics. He has a talent for explaining complex financial concepts in an accessible way and has published high-quality content in various publications. He is dedicated to delivering valuable information to readers, staying up-to-date with financial news and trends, and sharing his expertise with others.
Latest entries
 BlogJuly 8, 2024Introduction to Tax Liens and Deeds
 BlogOctober 30, 2023Exposing the Money Myth: Financing Real Estate Deals
 BlogOctober 30, 2023Real Estate Success: Motivation
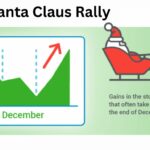 BlogOctober 28, 2023The Santa Claus Rally