
The financial playground is littered with tools. The utility of each varies with some being essential while others are not worth the time wasted to create them in the first place. As a new trader, remember your end goal is becoming a successful craftsman on Wall Street. Doing so requires first mastering a few essential tools. Here are the top 3 trading tools you must have:
- Stock Charts
- Scanning Software
- Risk Graphs
Stock Charts
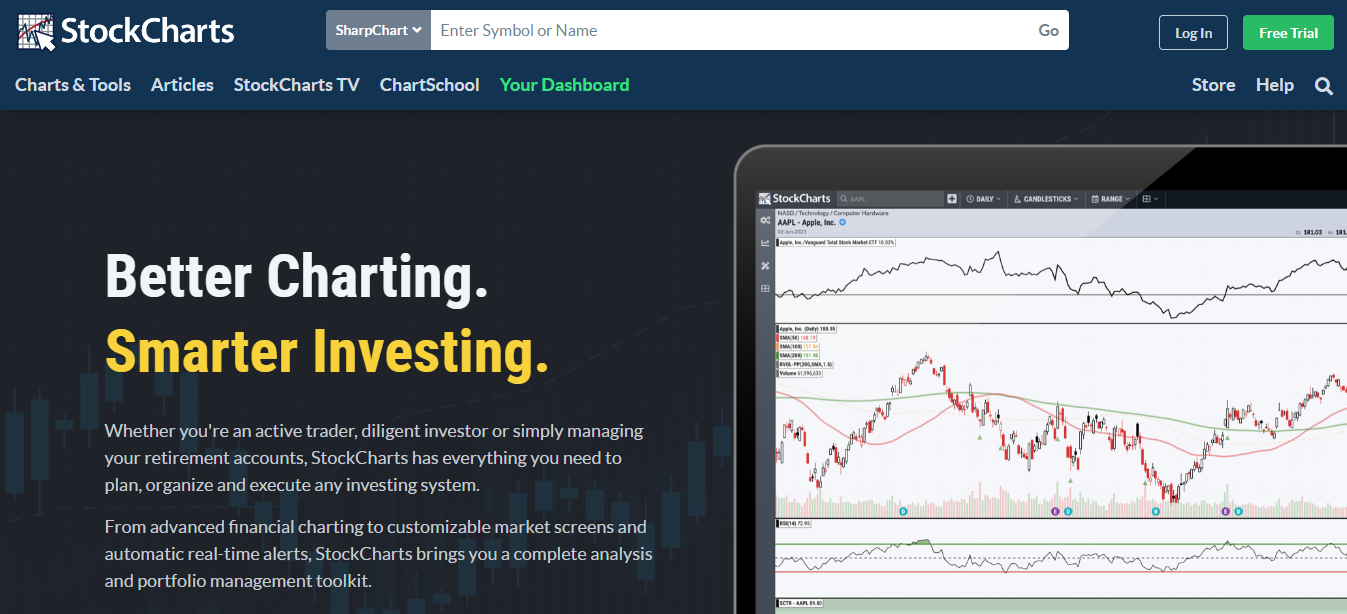
A stock chart plots the price of a stock over time. The necessity of such a tool can’t be overstated. An entire school of thought – technical analysis – is based on the evaluation of price charts. Think of price charts as the footprints of money. They quickly and easily reveal whether money is flowing into or out of a particular stock. This can tell you a lot about whether or not you should buy a company you’re interested in.
Another reason price charts are powerful tools is because the price of a stock reflects all knowable factors. Everything about the economic or political environment, the management of a company, its earnings and growth potential, and the mood of investors is already baked into the stock price. This means a price chart is a one-stop shop for comprehensive analysis. Many investors focus on trading with the trend of a stock – buying uptrends and selling downtrends. The only way a stock’s trend can be identified is with a price chart.
Scanning Software
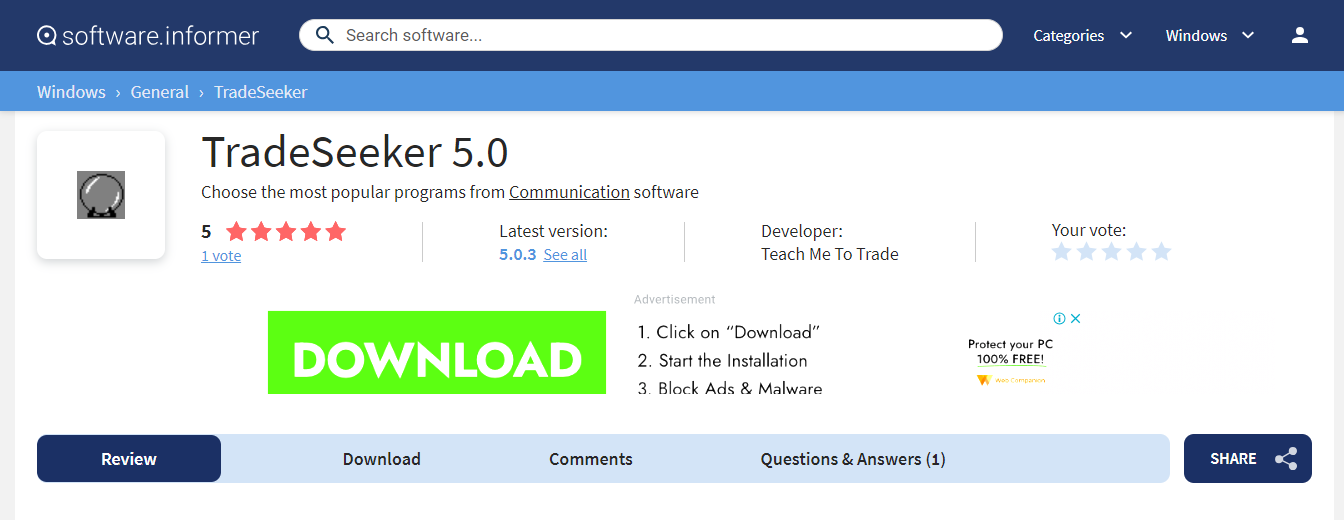
In the U.S. alone, there are upwards of 4,900 public companies available to trade on stock exchanges. The logistics of tracking that many stocks on a daily basis is staggering. It simply can’t be done without the aid of computer software. This is one of the primary advantages of having a scanning tool that will sift through the multitudes and find the exact stocks that are exhibiting the patterns you’re interested in. Within our powerful MachTrader software, we have a tool called the TradeSeeker which allows you to select a scan, input your own personal criteria, and instantly find which stocks qualify.
Risk Graphs
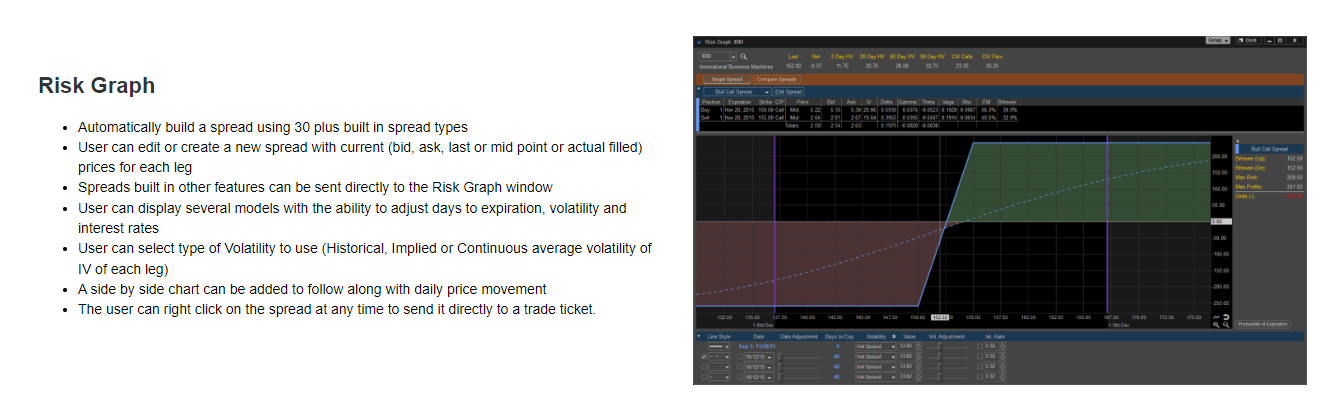
In the world of options trading, risk graphs are an indispensable tool that provides a visual representation of the risk and reward of an option position. It allows you to perform “what-if” scenarios to determine how the position will behave under different market conditions. Before you enter your trade, you will know exactly how much money is on the line and how a change in price, time, or volatility will influence your position.
Author Profile

- Jonas Taylor is a financial expert and experienced writer with a focus on finance news, accounting software, and related topics. He has a talent for explaining complex financial concepts in an accessible way and has published high-quality content in various publications. He is dedicated to delivering valuable information to readers, staying up-to-date with financial news and trends, and sharing his expertise with others.
Latest entries
 BlogJuly 8, 2024Introduction to Tax Liens and Deeds
 BlogOctober 30, 2023Exposing the Money Myth: Financing Real Estate Deals
 BlogOctober 30, 2023Real Estate Success: Motivation
 BlogOctober 28, 2023The Santa Claus Rally