
The world of charting is awash with indicators. These tools measure everything you can imagine from volatility and volume to momentum and relative performance. The utility of each study ranges from immensely helpful to utterly useless. The growth of these gadgets continues unabated as chartists of all stripes seem altogether unable to sate their appetite for tinkering.
Unfortunately, redundancy also runs rampant amid the masses of chart studies. One wonders if some of them were simply the brainchild of boredom or the creation of those with a penchant for wheel re-invention.
If you’re one of the many budding chartists feeling overwhelmed by the sheer number of tools available, take heart. Today’s post will help you cut through the clutter by highlighting 2 indicators you can’t trade without!
Pivots
What is the first and most important variable you should assess on a stock chart?
Why, the price trend, of course!
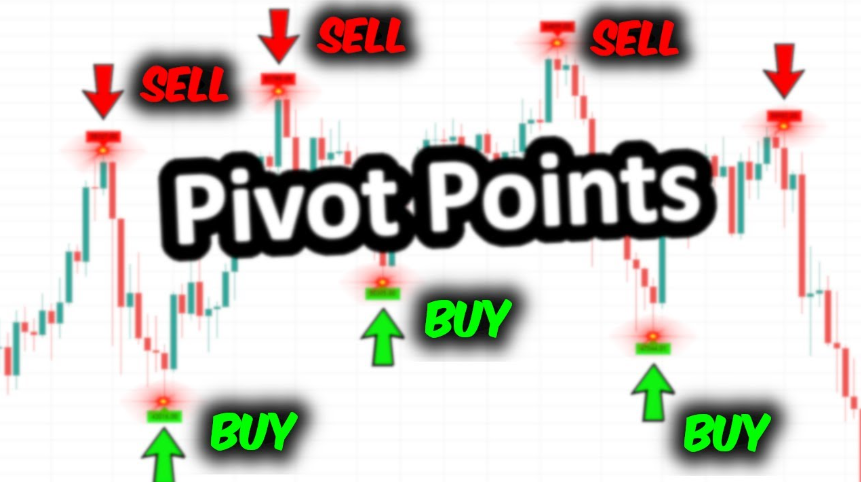
And you can’t determine the trend of a stock without analyzing the relationship between the recent pivots. Are they rising or falling? In other words, is the stock in an uptrend or downtrend? To aid in trend identification, the powerful MachTrader software comes equipped with the indispensable pivot study which automatically labels each and every pivot in the price chart. Take note of the accompanying chart of Apple Inc. (AAPL). The red arrows and R1 through R6 are identifying the pivot highs or resistance levels. The green arrows and S1 through S6 are identifying the pivot lows or support levels.
Given the continual rise of the pivots in the AAPL chart, it is obvious that this stock is in an uptrend and therefore a candidate for bullish trades. The pivot indicator becomes available once you upgrade to Mach III or Mach IV.
Volume
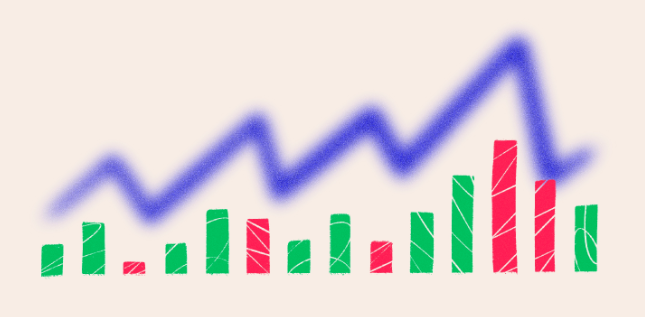
Next on our list of vital indicators is volume. This study shows up at the bottom of the chart as a histogram which measures the amount of shares traded each day. Volume is helpful in identifying both liquidity and institutional money flow. Due to the increased number of participants, high-volume stocks are easier to trade. Consider trading stocks that have at least 500K to 1 million shares traded daily. This will make it easier to buy and sell the stock quickly at your desired price.
Institutions like mutual funds, hedge funds, pension funds, and banks are the primary drivers of stock prices. However, they don’t exactly broadcast when they are buying or selling particular securities. Luckily, savvy traders can assess trading volume for clues into these behemoths’ behavior. High volume up days suggest that institutions are buying shares, and these days are therefore called accumulation days. Low volume down days suggests institutions are selling shares and are thus called distribution days. Multiple distribution days can serve as a warning sign that a stock is weakening and at risk of a correction.
Were I to tack on a third and fourth vital indicator they would be moving averages and comparative relative strength. Perhaps we’ll address these in a future post as today’s instruction is running a bit long.
To sum up, pivots and volume are a MUST if you want to master the art of charting. If you need help with using them, come join one of our free weekly MachTrader demos, and we’ll enlighten you.
Author Profile

- Jonas Taylor is a financial expert and experienced writer with a focus on finance news, accounting software, and related topics. He has a talent for explaining complex financial concepts in an accessible way and has published high-quality content in various publications. He is dedicated to delivering valuable information to readers, staying up-to-date with financial news and trends, and sharing his expertise with others.
Latest entries
 BlogJuly 8, 2024Introduction to Tax Liens and Deeds
 BlogOctober 30, 2023Exposing the Money Myth: Financing Real Estate Deals
 BlogOctober 30, 2023Real Estate Success: Motivation
 BlogOctober 28, 2023The Santa Claus Rally