
One of the more popular avenues used by traders to discover trade ideas is top down analysis. Consider it a multi-step process that begins on a broad level and gets progressively more specific with each step. Here’s the gist of the approach:
- Assess the broad market
- Find the best sector
- Find the best stock within that sector
This is a tried and true method we come back to time and again in our weekly trading labs to identify potential trading opportunities. Allow me to illustrate using current market conditions.
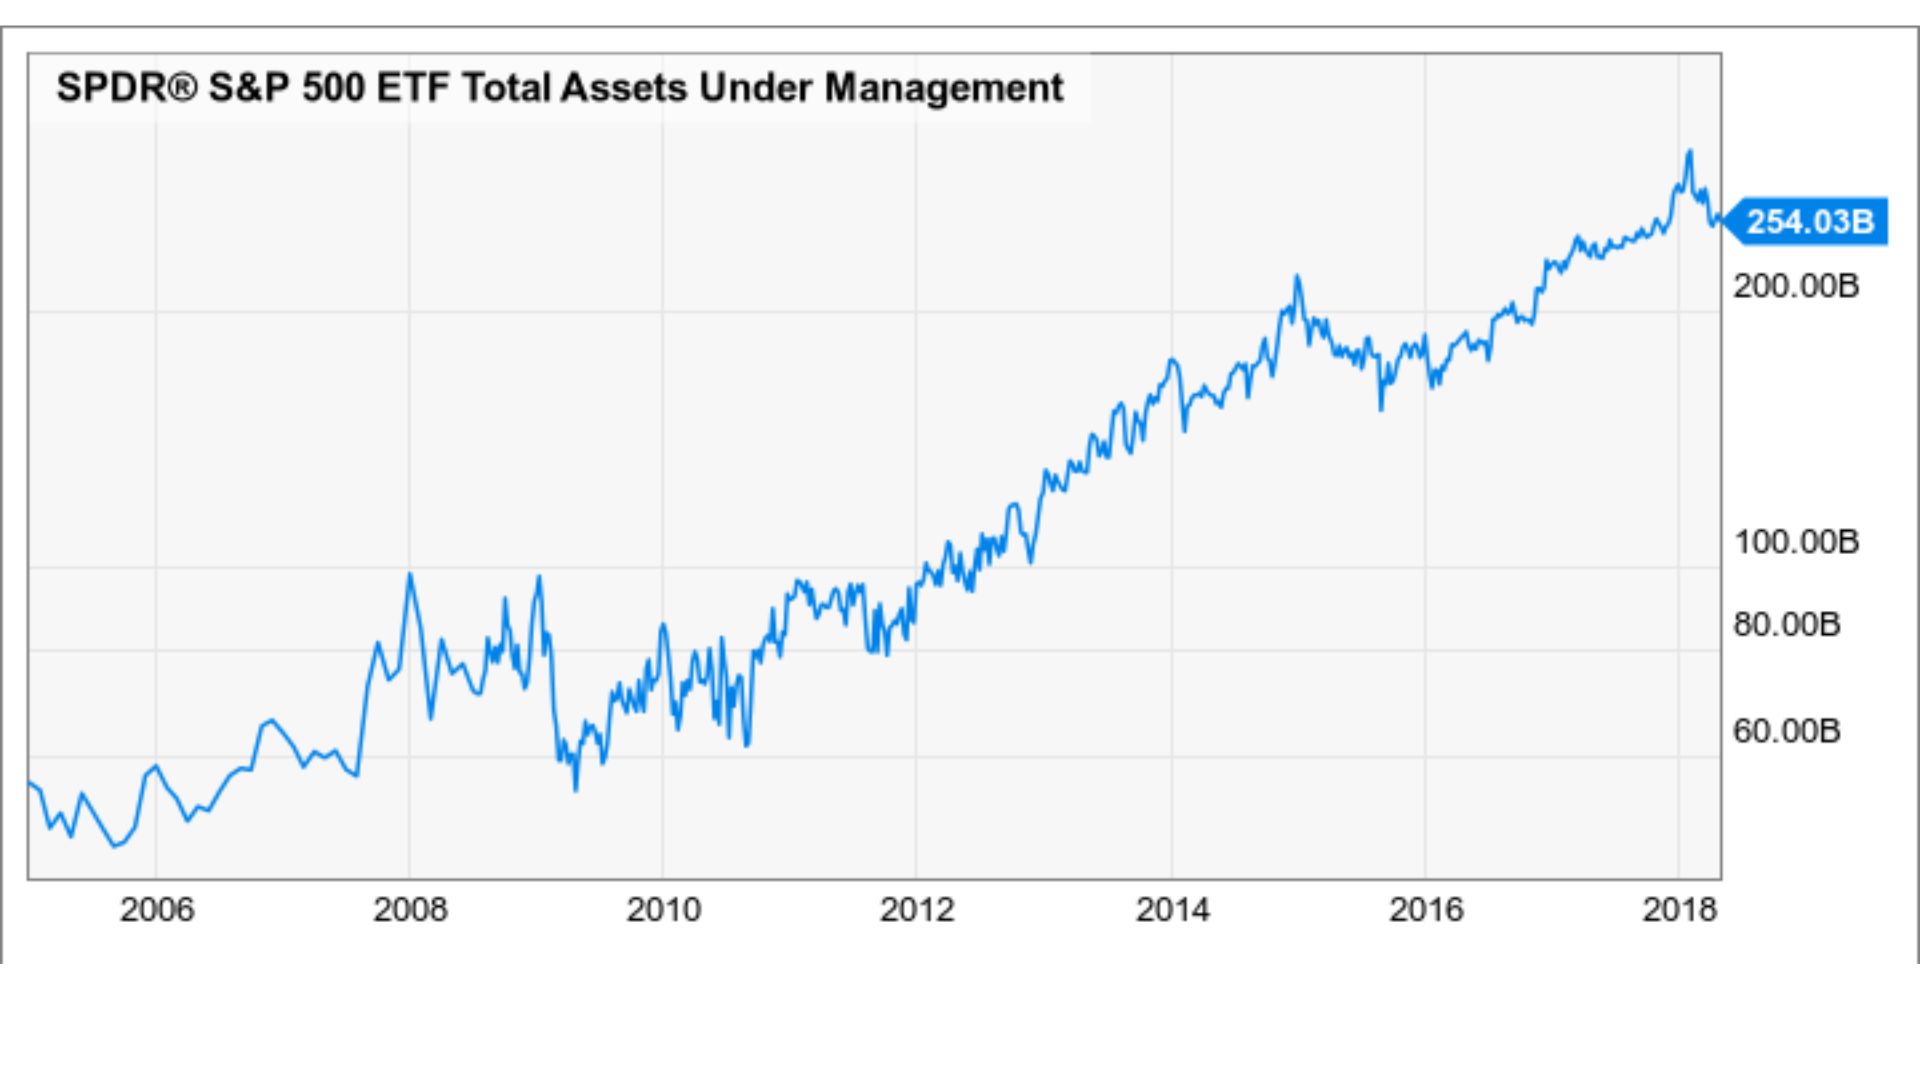
We begin by taking a brief look at the S&P 500 Index to determine the overall trend and any price patterns that are developing. As shown in the S&P 500 ETF chart below, we are in an uptrend with a three day pullback to a rising 20-day moving average.
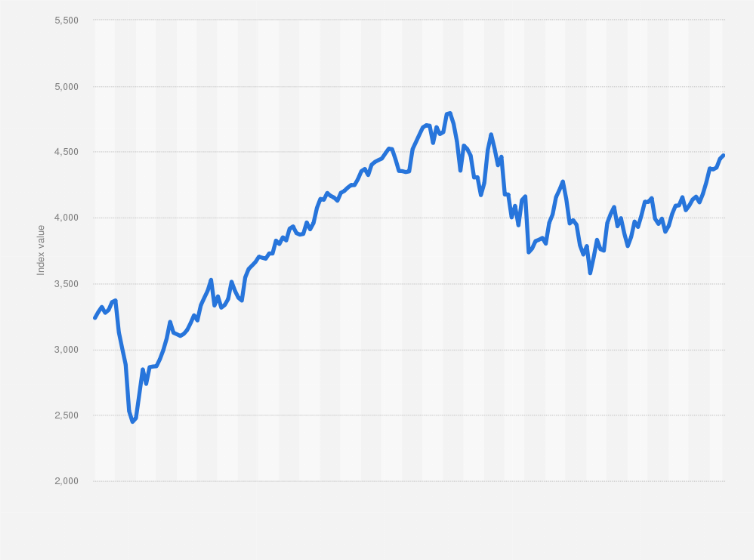
Next, we dig a bit deeper by assessing the nine major market sectors to see which one is in the strongest uptrend and offering the best trading opportunity. If you haven’t yet built a watch list for sectors in your Mach Trader quote sheet, you can import the full list by right clicking in the quote sheet, selecting “import symbols”, and then finding the list that says “sector spdrs”. This will automatically input all the relevant exchange traded funds for the nine major sectors. We could go through the charts of each sector one by one to determine which one has the best setup.
A different method involves utilizing the robust sector rotation feature found in the tools menu (Navigate to Tools > Broad Markets > Sector Rotation: Sector SPDR Perfchart). The graphic below shows the performance of each sector relative to the S&P 500 Index over the past month. While utilities have been the worst performer, energy has been the best.
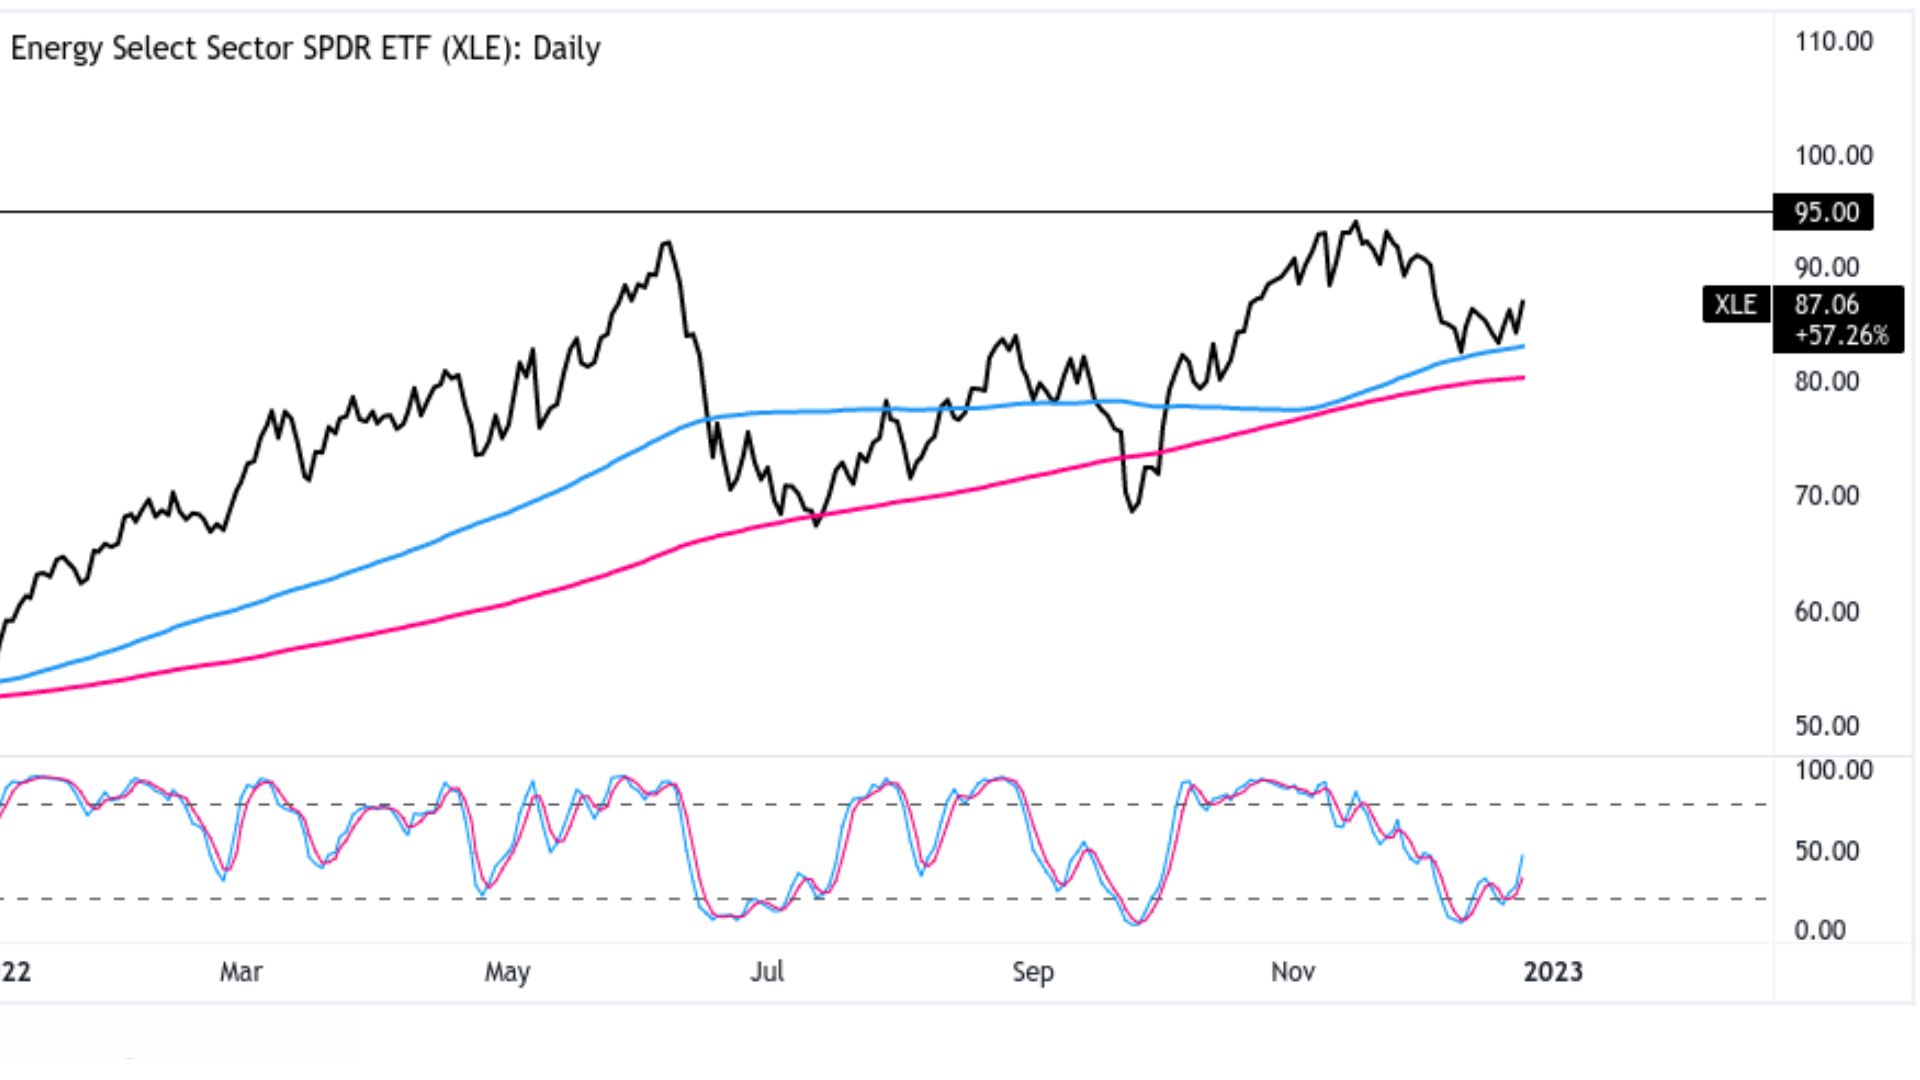
A cursory glance at the energy sector chart (XLE) reveals it’s in a clean uptrend with a four-day pullback.
The final step consists of drilling down into the energy sector to identify an individual stock that’s providing a compelling entry point. Thankfully, the MachTrader simplifies this aspect. You can import all the energy stocks that comprise the Energy Sector Fund (XLE) in the quote sheet by right-clicking, selecting “import symbols”, and finding the list that’s titled “XLE”. Once the ticker symbols are input to your quote sheet you can go through the stocks one-by-one to determine which one looks best.
One of the better-looking setups in the energy space is Tesoro Corp (TSO). Since staging a high-volume breakout it’s formed an orderly low-volume pullback providing a textbook bull retracement pattern.
There’s no need to struggle to find trade ideas or to spend hours each night pouring through hundreds of charts. If you’re equipped with the right tools and the right knowledge it’s a piece of cake.
Author Profile

- Jonas Taylor is a financial expert and experienced writer with a focus on finance news, accounting software, and related topics. He has a talent for explaining complex financial concepts in an accessible way and has published high-quality content in various publications. He is dedicated to delivering valuable information to readers, staying up-to-date with financial news and trends, and sharing his expertise with others.
Latest entries
 BlogJuly 8, 2024Introduction to Tax Liens and Deeds
 BlogOctober 30, 2023Exposing the Money Myth: Financing Real Estate Deals
 BlogOctober 30, 2023Real Estate Success: Motivation
 BlogOctober 28, 2023The Santa Claus Rally