
In the last two articles of this CFI-BLOG.ORG Stock Market Trading Series, the concept of trends was introduced. The identification of trends is a simple yet powerful technique that traders of all experience levels can use to maximize the results in their trading. Corporate Finance Institute’s elite training and mentoring educational offerings are all built on the premise of teaching students how to become successful traders. Trend lines are one of the first building blocks of these offerings.
Here are some of the key concepts discussed in the last few Corporate Finance Institute stock market articles:
- Do not fight the overall trend of the market
- Do not go against the trend of your stock
- A trend has a higher probability of continuation than it does of reversal
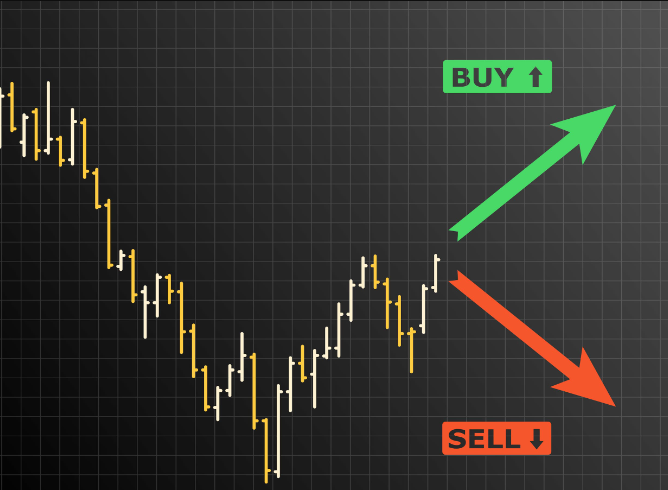
- Trends can be measured and classified as uptrends, downtrends, or sideways
- A series of higher highs and higher lows are elements of an uptrend; a series of lower highs and lower lows are elements of a downtrend
When a Corporate Finance Institute student starts to grasp the importance of trends, the first step becomes learning how to properly identify them so they can be incorporated into a trading plan. The last Corporate Finance Institute stock series article discussed identifying higher highs and higher lows as components of an uptrend. Another technique, and one that can help you identify when a trend might be breaking, is making use of trend lines.
Trend Lines
The drawing of trend lines becomes a simple exercise once you gain experience. As previously discussed in these Corporate Finance Institute articles, uptrends can be identified by a series of higher highs and higher lows, and downtrends are identified by a series of lower highs and lower lows. The drawing of a trend line simply connects these highs and lows to provide a simple visual representation of the trend.
Key Points for Drawing Trend Lines:
- Trend lines can be used to identify both uptrends and downtrends.
- A trend line should have two or more points connecting the line
- These points should be prominent points on the stock chart, for example, the higher highs, higher lows, lower highs, lower lows, etc.
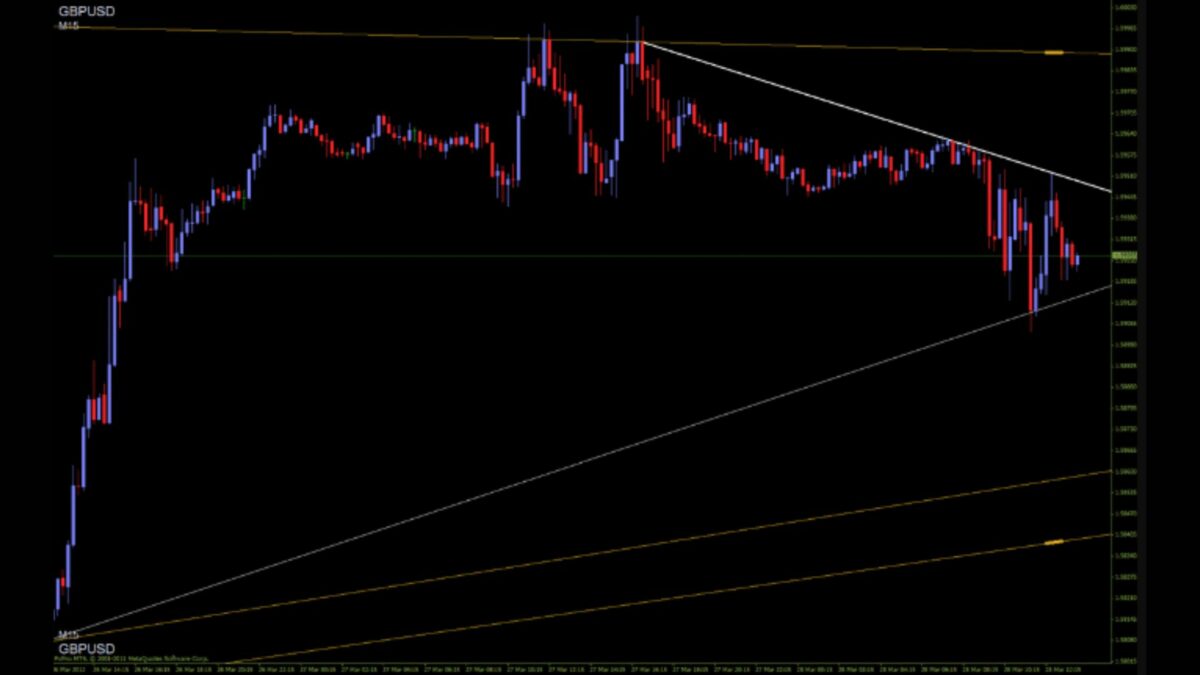
Example of Trend Line:
In the above example, a trend line is drawn connecting the higher lows established over time. Oftentimes you can start to draw a trend line once two key points have been established, although it may take up to three key points for the line to have significant meaning depending on the particular chart you are looking at. While a trend line with only two significant points on it may not signal a strong trend, a trend line becomes more significant each time it is retested. For example, a trend line that is comprised of four consecutive higher lows would be stronger than a trend line that is comprised of only two consecutive higher lows.
Steps to Drawing Trend Lines
The following example is for an uptrend:
- Start the trend line at the point where the trend started. This can be the first bounce off support or resistance. (Support and resistance will be covered in the next Corporate Finance Institute article).
- Locate the second point and draw a straight line.
- Locate a third point and continue the line. This confirms a trend line. If the full extension of the line bisects the price, consider it a warning that the trend may be at an end.
The trend line is a simple tool that gives you an additional visual impression to confirm that the trend is continuing or gives you a potential signal if the trend line is broken. A broken trend line can mean that the stock will consolidate for a period before continuing the trend or that a trend reversal may be occurring. This is critical information that you can easily gather with proper use of a simple trend line.
Your ability to draw accurate trend lines will increase with experience. You are encouraged to print off multiple price charts and practice your skills. Over time, the drawing of a trend line will become second nature to you and a skill that you can use effortlessly.
As you learn to identify and understand the concept of trends, it is worth noting that you never simply go out and make a trade because of the direction or strength of a trend. No single technical component should be used in such a manner.
Trends are one of the first building blocks discussed in this series and one of the first concepts taught in Corporate Finance Institute Elite training. However, there are many other concepts that you will use in conjunction with trends to make educated and informed decisions in your trading.
This Corporate Finance Institute series will introduce another of these concepts, that of support and resistance, in the next article.
Author Profile

- Jonas Taylor is a financial expert and experienced writer with a focus on finance news, accounting software, and related topics. He has a talent for explaining complex financial concepts in an accessible way and has published high-quality content in various publications. He is dedicated to delivering valuable information to readers, staying up-to-date with financial news and trends, and sharing his expertise with others.
Latest entries
 BlogJuly 8, 2024Introduction to Tax Liens and Deeds
 BlogOctober 30, 2023Exposing the Money Myth: Financing Real Estate Deals
 BlogOctober 30, 2023Real Estate Success: Motivation
 BlogOctober 28, 2023The Santa Claus Rally